© 2014 iLearn Systems, Inc.
Designed and Developed for PMI, the Practical Memory Institute®
Baseline Dataset
Progress Dataset-1
Progress Dataset-2
Progress Dataset-3
Progress Dataset-4
All Results
Baseline
2011-11-27
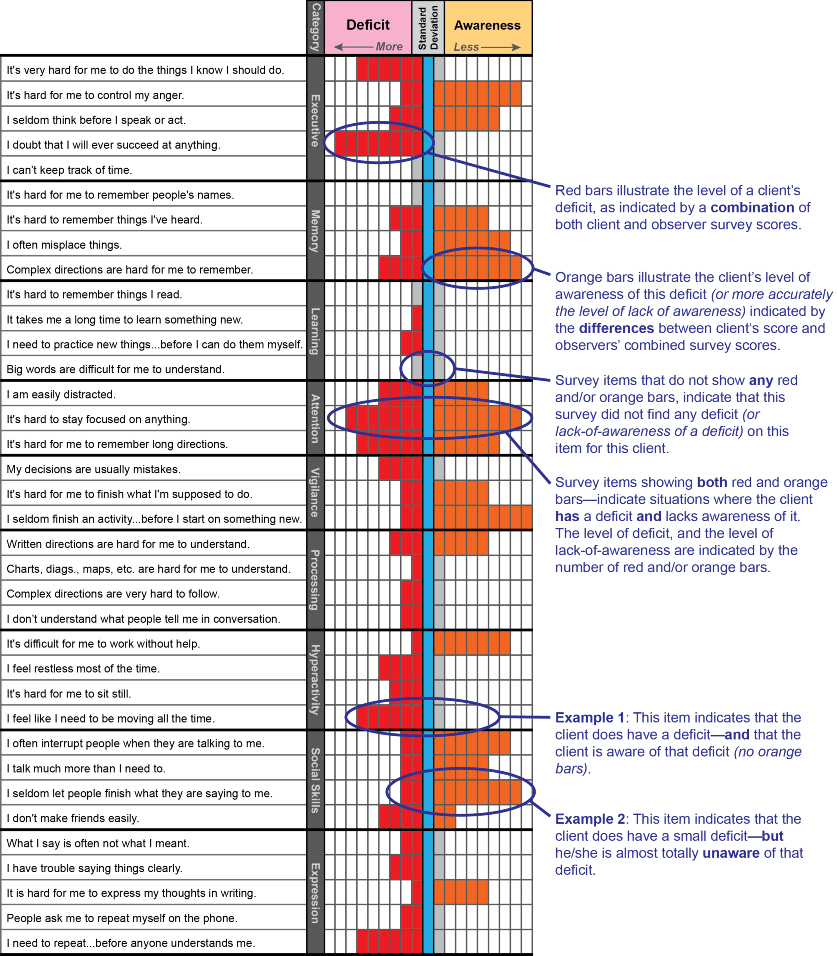
How To Read This Graphic:
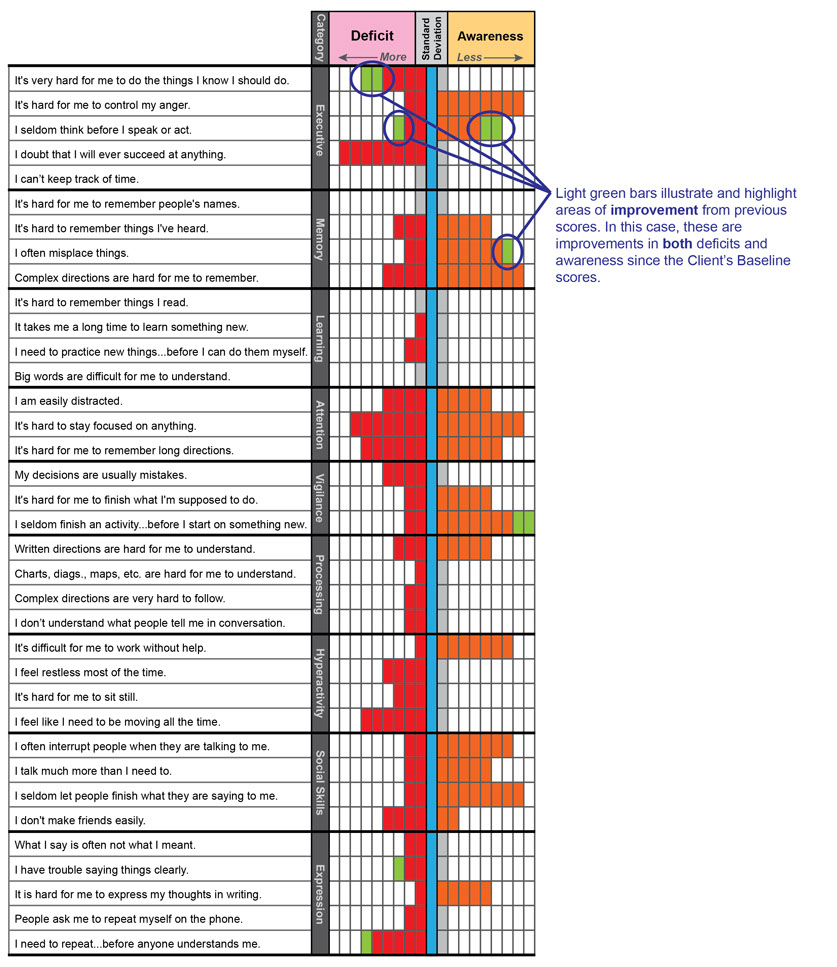
Progress-1
2012-2-8
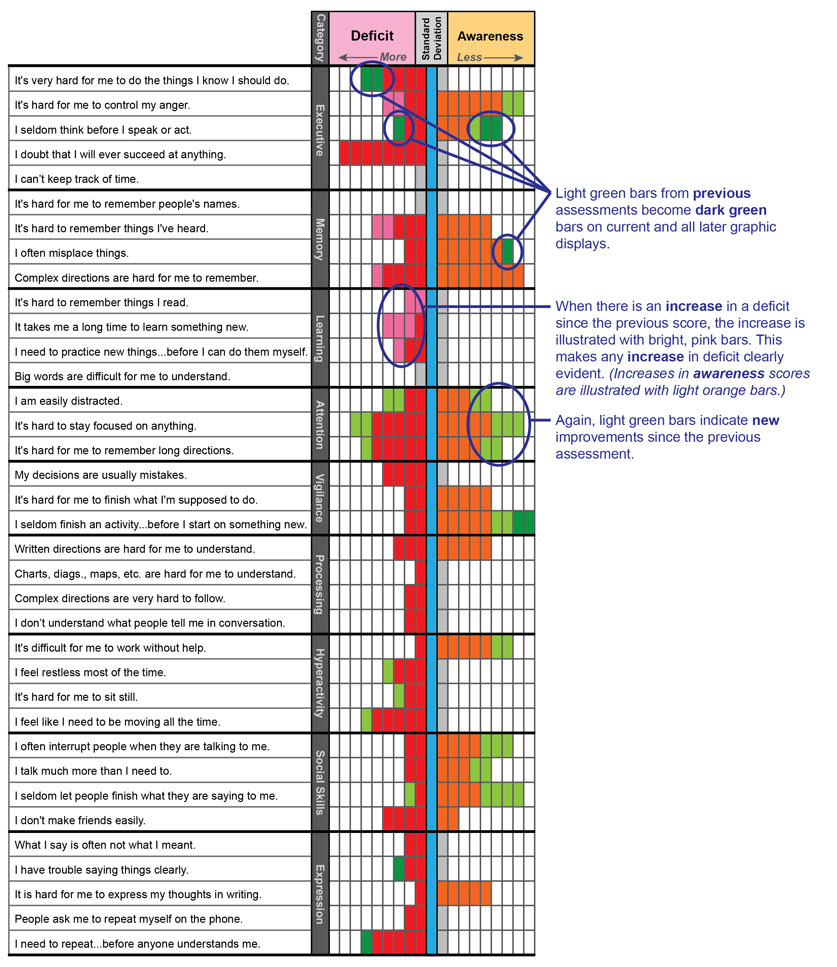
How To Read This Graphic, cont.:
Progress-2
2012-5-30
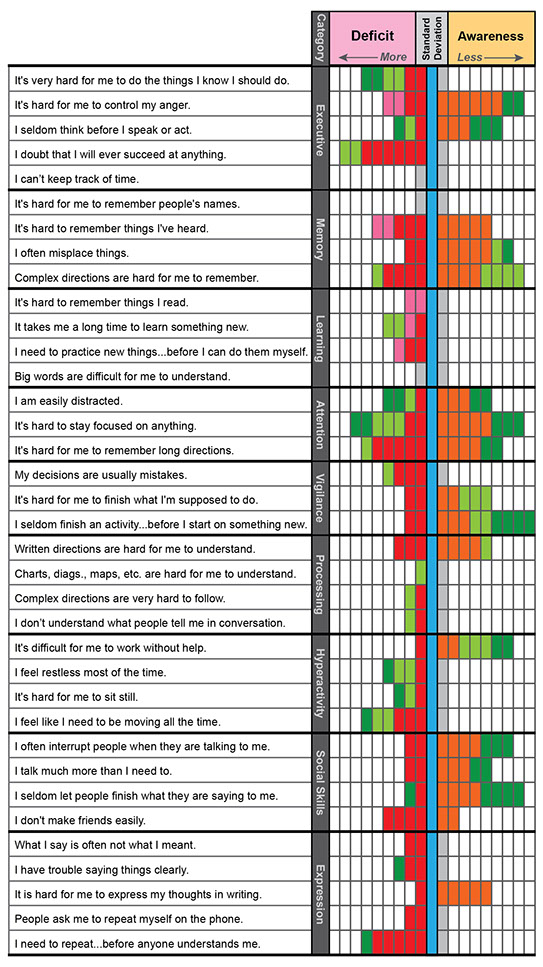
How To Read This Graphic, cont.:
Progress-3
2012-7-19
Progress-4
2012-9-12
How To Read This Graphic, cont.:
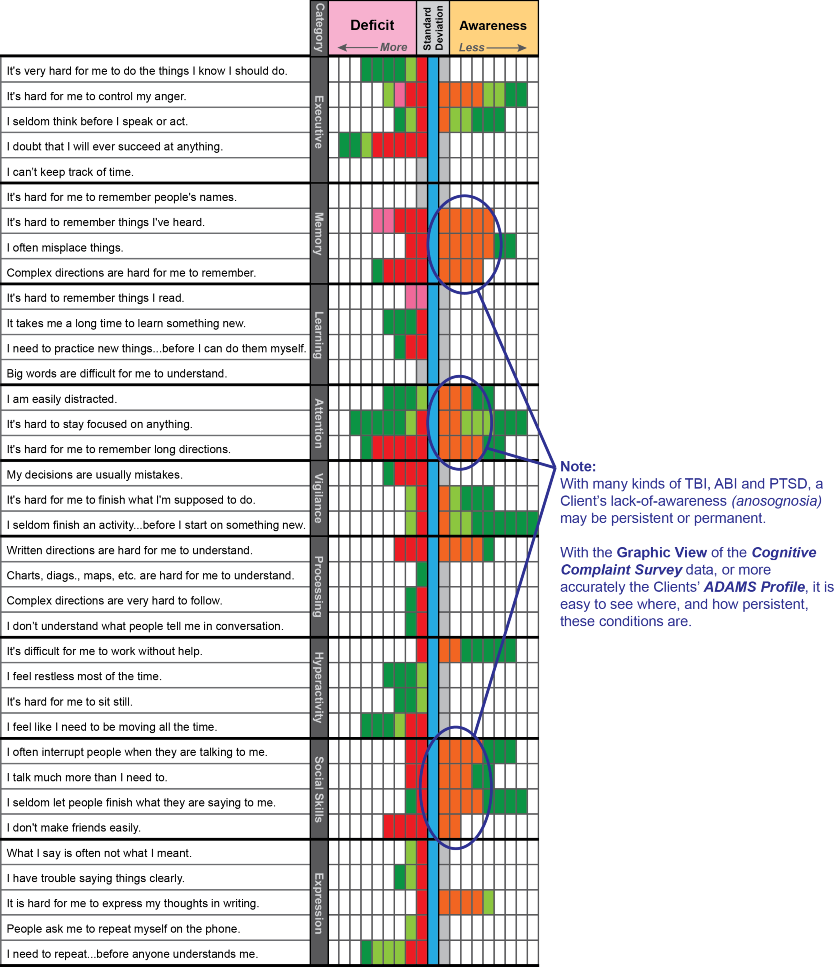
Knowing which areas of deficit awareness are persistant or permanent allows clinicians to refocus rehabilitation efforts where these efforts can have the greatest benefit or affect.
Baseline
2011-11-27
Progress-1
2012-2-8
Progress-2
2012-5-30
Progress-3
2012-7-19
Progress-4
2012-9-12

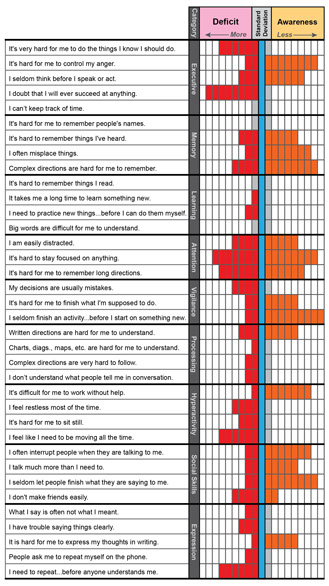


One of the best ways to view a Client's progress is to look at the Graphic View of all ADAMS Profile assessments (the All Results tab above).
In this view, it is easy to see all deficits, all awareness levels, and the progress (or lack of progress) over time—for each and every category and category item. This makes it possible to tailor a Client's specific Treatment Plan to the Client's unique needs as their cognitive rehabilitation progresses.
Note:
The Baseline Cognitive Complaints Survey identifies client deficits and deficit awareness.
This initial Baseline pattern is presented on all Progress Datasets to illustrate improvements resulting from the treatment regime.
Light green blocks indicate current improvements from the original Baseline levels. Dark green blocks illustrate past improvements over time.
A Treatment Plan is custom designed to address these deficits.
Color Code:
Normal, No Deficit
Standard Deviation
Deficit measure
Lack of Awareness measure
Current improvement
Previous improvement
Deficit worsening
Awareness worsening